Free Construction Unit Cost Databases: The Best Sources for Estimators in 2026
Every construction estimator wants accurate, current, location-specific cost data — and every estimator knows the reality: the industry-standard cost database..
.jpg?alt=media&token=8804e88c-4a2f-41e9-ad06-8a6a5979593b)
Contents
Every construction estimator wants accurate, current, location-specific cost data — and every estimator knows the reality: the industry-standard cost databases (RSMeans, Craftsman Book Company, PriceBook) are subscription-priced at $2,000–$7,000 per user per year, with enterprise pricing starting at $25,000 annually. For solo estimators, small GCs, government facility teams, students, and cost-conscious contractors, that pricing model is a real barrier. Fortunately, a workable free cost data stack does exist, assembled from federal government sources, state DOT bid tabulations, industry associations, supplier-integrated tools, and free trials of the paid platforms. This article maps that stack, organized by where in the estimating workflow each source fits.
The audience is the estimator, project manager, or small contractor who needs cost reference data without the enterprise subscription. This is not an argument that free data substitutes for RSMeans; it doesn't, for the reasons explained below. It is a practical guide to what free data can and cannot do, which sources deliver the most useful data for which project types, and how to build an estimating workflow that combines free sources into something workable.
Key Takeaways
Free cost data exists, but with real trade-offs. Government sources (BLS, Census Bureau, state DOTs), industry association research (NAHB, ABC), and free tiers of commercial platforms provide legitimate baseline data. The trade-off vs. RSMeans is granularity, update frequency, and location-specificity.
The free stack is workflow-assembled, not single-source. No free source matches RSMeans's 92,000+ line items across 970 markets. A workable free stack pulls labor data from BLS, material price trends from producer indexes, unit costs from state DOT bid tabulations, and localization from free calculator tools.
BLS is the anchor for labor cost data. The Occupational Employment and Wage Statistics (OEWS) program publishes hourly wage data by occupation for every metropolitan area in the U.S. — the same underlying data most commercial databases use for labor rates.
State DOT bid tabulations are the best free source for civil construction unit costs. Every state DOT publishes historical weighted average bid prices for standard pay items. For infrastructure, heavy civil, and public-sector work, this data is often more current and location-specific than commercial databases.
RSMeans and Craftsman offer free trials. For estimators doing one bid at a time who want RSMeans-quality data, the 30-day free trials are often enough for a single project, with the discipline to complete the estimate within the trial window.
Why Free Cost Data Has Real Limitations
Before mapping the sources, it helps to be specific about what free data cannot do and why commercial databases command their pricing.
Location-specificity is the biggest gap. RSMeans covers 970 U.S. and Canadian markets with location-specific pricing. Free federal data (BLS) covers metropolitan areas well, but rural markets and county-level pricing are typically at the national or regional average. For a project in a metro area, free data works reasonably; for rural work, the gap is larger.
Update frequency matters for volatile materials. RSMeans updates cost data quarterly for volatile categories (lumber, steel, copper, concrete). Federal data (BLS Producer Price Index) updates monthly at the national level but with less granular category detail. State DOT bid tabulations often lag 6–12 months. For projects sensitive to material price movements, this lag can lead to meaningful estimation errors.
Line-item granularity varies dramatically. RSMeans has 92,000+ unit line items organized by CSI MasterFormat divisions. Free sources aggregate at higher levels, BLS reports wages by broad occupation, and PPI reports material prices by broad category. Building an estimate at the line-item level from free data requires more interpretation work than pulling from a commercial database.
Productivity factors are the hardest to find for free. Unit costs require both the material/labor rate and a productivity assumption (labor hours per unit installed). RSMeans includes productivity factors calibrated by trade and project type. Free data rarely includes this — most estimators using free data have to derive productivity from historical project records or industry benchmarks.
Insurance, dispute, and audit contexts favor RSMeans. RSMeans is the recognized standard for public-sector procurement, insurance valuations, and independent cost verification. Estimates based on free data may be technically defensible but face a steeper burden of proof in disputes or public-agency reviews.
These limitations are real. That said, a well-assembled free data stack is more than adequate for many use cases: solo residential estimators, small commercial GCs bidding in local markets, government facility teams doing early-phase feasibility work, students building portfolio estimates, and any estimator doing conceptual budgeting before committing to a paid subscription.
The Free Cost Data Workflow at a Glance
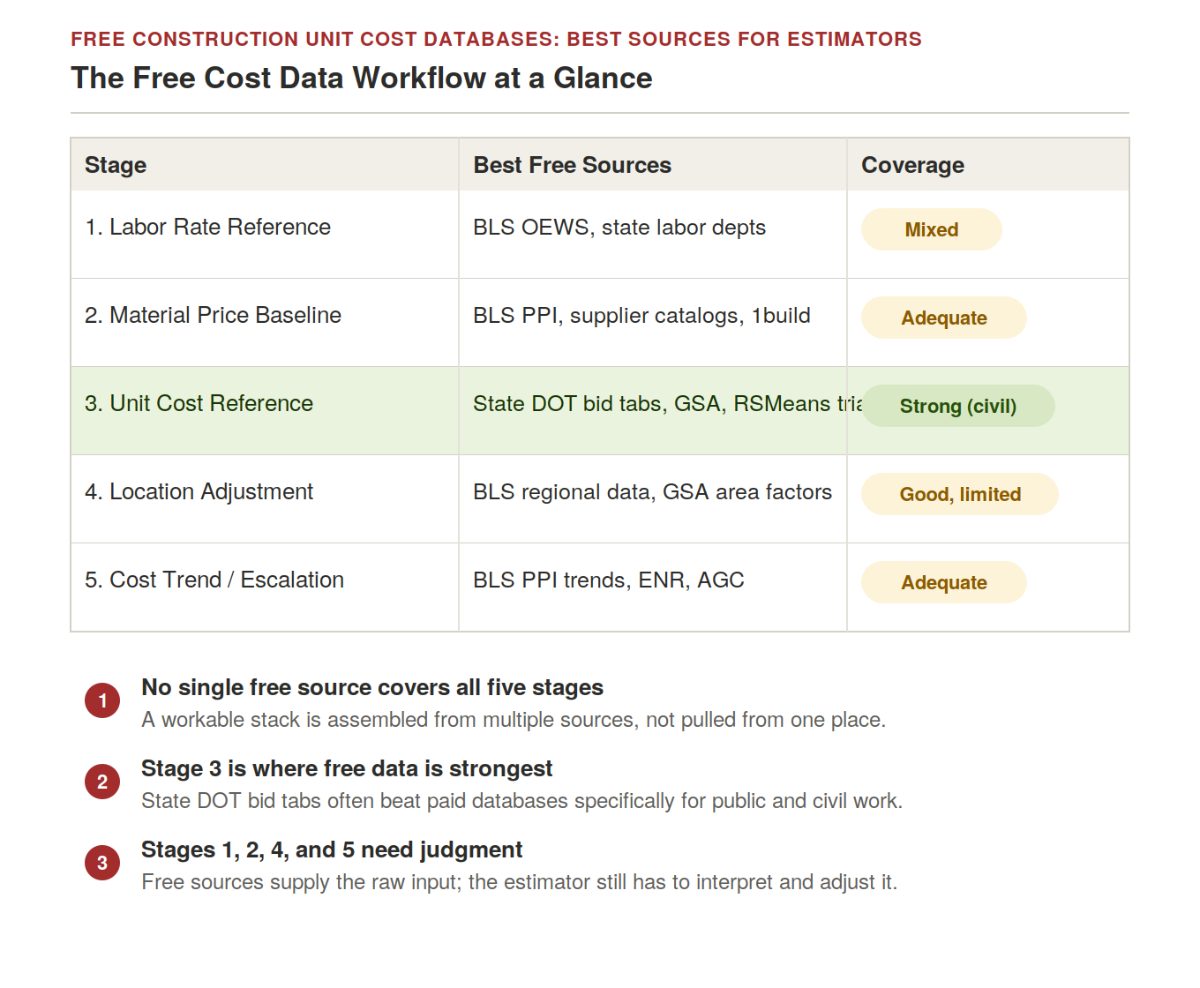
Free cost data feeds the estimating workflow in five stages. Each stage has its own leading free sources, and each has different levels of coverage vs. the paid alternatives.
Stage | What Estimators Do | Best Free Sources | Coverage vs. Paid |
1. Labor Rate Reference | Establish current wage rates by trade + geography | BLS OEWS, state labor departments | Good in metros, weak in rural areas |
2. Material Price Baseline | Establish current material costs | BLS Producer Price Index, supplier catalogs, 1build free tier | Adequate for volatile material tracking |
3. Unit Cost Reference | Get complete unit cost data (material + labor + equipment) | State DOT bid tabs, GSA data, RSMeans/Craftsman trials | Strong for civil, moderate for building |
4. Location Adjustment | Adjust national/regional data to the local market | BLS regional indexes, GSA area factors, free calculators | Good with limitations |
5. Cost Trend / Escalation | Forecast material price movement | BLS PPI trends, ENR indexes, industry reports | Adequate for near-term forecasting |
The free stack is genuinely usable across these five stages, but assembling it requires more estimator time than pulling everything from RSMeans. The trade-off is time-for-money: free sources cost hours; paid subscriptions cost dollars.
Stage 1: Labor Rate Reference — Federal and State Government Sources
Labor is typically 40–60% of construction cost, and getting labor rates right is the single most important cost input. The good news: federal wage data is publicly available, updated regularly, and covers every metropolitan area in the U.S.
Bureau of Labor Statistics (BLS) Occupational Employment and Wage Statistics (OEWS): The primary source for U.S. wage data by occupation and geography. OEWS publishes hourly wage data (median, mean, 10th/25th/75th/90th percentile) for every construction occupation across every U.S. metropolitan statistical area. Data updates annually with May of the prior year as the reference period.
The OEWS categories map cleanly to construction trades: Construction Laborers, Carpenters, Electricians, Plumbers, Sheet Metal Workers, HVAC Mechanics, Structural Iron and Steel Workers, and dozens more. For an estimator building a labor rate schedule, OEWS provides the wage foundation.
BLS Producer Price Index (PPI): Tracks month-over-month changes in prices for construction materials and services. Categories include Ready-Mix Concrete, Steel Mill Products, Softwood Lumber, Copper Wire, Structural Steel, Prefabricated Wood Buildings, and many more. Historical data goes back decades.
For estimators, the PPI is less useful for absolute pricing than for trend tracking. If steel PPI is up 12% year-over-year, the estimator knows to adjust their steel unit costs accordingly.
State labor departments: Most state labor departments publish state and metro-area wage data that supplements the BLS. For prevailing wage work (Davis-Bacon federal, state prevailing wage laws), state labor departments are the authoritative source for the required wage rates on public-sector projects.
Employment Cost Index (ECI): The BLS also publishes the Employment Cost Index, tracking labor cost changes, including benefits and payroll taxes. For estimators calculating fully burdened labor costs, ECI provides the escalation factor for benefits and burden on top of the base wage rate.
Specifically for labor cost data, the free federal sources are genuinely competitive with paid databases. The gap is not in labor data quality — it's in the labor-to-productivity conversion, which requires additional work to derive from historical project data.
Stage 2: Material Price Baseline — Supplier Catalogs and Federal Data
Material pricing is more challenging free than labor. Paid databases aggregate supplier pricing across thousands of sources; free sources require more assembly.
BLS Producer Price Index (PPI) — Detailed Categories: Beyond the top-level PPI, BLS publishes detailed category data for hundreds of construction materials. Estimators can track specific commodity prices — hot-rolled steel bars, ready-mix concrete, structural clay tile, and insulating board, with monthly updates.
The limitation: PPI reports index values (100 = base year), not actual dollar pricing. Estimators must combine PPI trend data with a known baseline price to derive current pricing. This works well for tracking movement in a category the estimator already has recent pricing on; it works less well for entering a new category from scratch.
Supplier catalogs and manufacturer pricing: Major building materials suppliers publish current pricing on their websites. Home Depot Pro, Lowe's Pro, Grainger, Fastenal, and specialty suppliers all provide accessible pricing that estimators use for reference. This data is real-time but limited to what the supplier stocks — good for common materials, weaker for specialty items.
1build free tier / supplier-integration platforms: 1build is a supplier-integration platform that aggregates material pricing from national and regional suppliers into a searchable database. Used by Projul and other construction management platforms, 1build offers a free tier for individual estimators — useful for pulling current material pricing without committing to a full subscription.
RSMeans and Craftsman free trials: Both major cost databases offer free trials — RSMeans typically 30 days on the Data Online platform, Craftsman with similar trial access to its online tools. For estimators who need current, complete cost data for a single project, the discipline of completing the estimate within the trial window is a legitimate free path to enterprise-quality data.
NAHB material cost data:The National Association of Home Builders publishes material cost research, particularly for residential construction. NAHB's monthly Cost of Construction Survey tracks residential material costs and is freely available. For residential-focused estimators, NAHB data is a strong free source.
Stage 3: Unit Cost Reference — State DOT Bid Tabulations Are the Sleeper Source
The most underused free cost data source in the industry is the state DOT bid tabulations. Every state Department of Transportation publishes historical bid data for state highway and infrastructure projects — including weighted average unit prices for standard pay items by county, region, and time period.
State DOT weighted average unit cost databases. For every state DOT, publicly accessible databases show what contractors have actually bid for standard construction items over recent months and years. Categories include earthwork, base courses, pavement (asphalt and concrete), drainage, structures, guardrail, signing, striping, landscaping, and hundreds of other items — with real bid pricing from real projects. Access varies by state: search "[state] DOT weighted average unit prices" or "[state] DOT bid tabulations" to find each state's data portal. Larger states have particularly rich data — for example,Washington State DOT andNew York State DOT both publish searchable bid tabulation archives.
For heavy civil, transportation, and public-sector construction, state DOT data is often more current, more location-specific, and more relevant than commercial cost databases. The data reflects what contractors are actually bidding, not what a national database estimates.
Access varies by state. Search "[state] DOT weighted average unit prices" or "[state] DOT bid tabulations" to find each state's data portal. Larger states (California, Texas, Florida, New York) have particularly rich data. FHWA maintains a national listing of state DOT resources.
GSA construction cost data. The General Services Administration (GSA) publishes construction cost data used for federal facilities projects. GSA's cost estimating guidance includes assembly-level and system-level cost benchmarks. Not as granular as RSMeans, but authoritative for federal facilities work.
FEMA construction cost data. FEMA's disaster recovery cost estimating tools include cost data for building reconstruction and public infrastructure repair. Free to access, useful for insurance, disaster recovery, and public-sector work.
Public university library research databases. Many university libraries maintain construction cost estimating research guides with links to accessible databases and industry reports. The University of Missouri Libraries Construction Cost Estimating Data guide is one example — a curated set of free and library-accessible sources.
Stage 4: Location Adjustment — Free Approaches to Localization
RSMeans's City Cost Index (CCI) adjusts national average pricing to 970 specific markets. Free equivalents exist, but with less precision.
BLS regional and metro cost indexes: BLS publishes regional price parities and metropolitan area cost of living indexes. These provide legitimate localization factors, though at broader geographic granularity than RSMeans CCI.
GSA per diem rates and area factors: GSA publishes locality-based cost factors used for federal reimbursement. Not construction-specific, but the geographic distribution of GSA factors correlates with construction cost variation and can serve as a rough localization index.
Free construction calculators with localization: Several free platforms (CostFlowAI, Craftsman's residential calculator tools, various free estimator apps) offer state-level cost localization built into their calculators. The underlying data is typically derived from BLS regional indexes plus published construction cost surveys.
Building it yourself from BLS metro wage data: An estimator can build a working local cost index by pulling BLS OEWS wage data for their target metropolitan area and comparing it against the U.S. average. If local carpentry wages are 15% above the national average, applying a 1.15 labor multiplier to national baseline pricing gets a reasonable local adjustment. This is what most published cost indexes do at a higher level of methodological rigor.
The free localization approach is workable but requires more estimator judgment than paid databases. The largest gaps are in rural markets and specialty trade coverage.
Stage 5: Cost Trend and Escalation Forecasting
For projects awarding months in the future, current-day cost data isn't enough — estimators need to forecast likely material and labor price movement.
BLS PPI trend data: The most useful free source for cost escalation. PPI history shows month-over-month and year-over-year movement in specific material categories. An estimator can build a 3-month, 6-month, or 12-month escalation forecast by applying the recent PPI trend to the current baseline pricing.
Engineering News-Record (ENR) construction cost indexes: ENR publishes the Construction Cost Index (CCI) and Building Cost Index (BCI), tracking construction cost movement nationally and in 20 major cities. Historical index data is freely accessible; current-month data typically requires an ENR subscription. For most estimators, the historical trend view is what matters most for escalation forecasting.
AGC and industry association reports: The Associated General Contractors of America (AGC) publishes construction industry economic reports covering material price trends, labor availability, and market conditions. Freely available.
Quarterly construction cost reports: Gordian, Turner, JLL, CBRE, and other firms publish quarterly construction cost outlook reports with market analysis. These are typically freely available (though gated behind email registration). Excellent for narrative context on where prices are heading.
How to Combine Free Sources Into a Working Estimating Stack
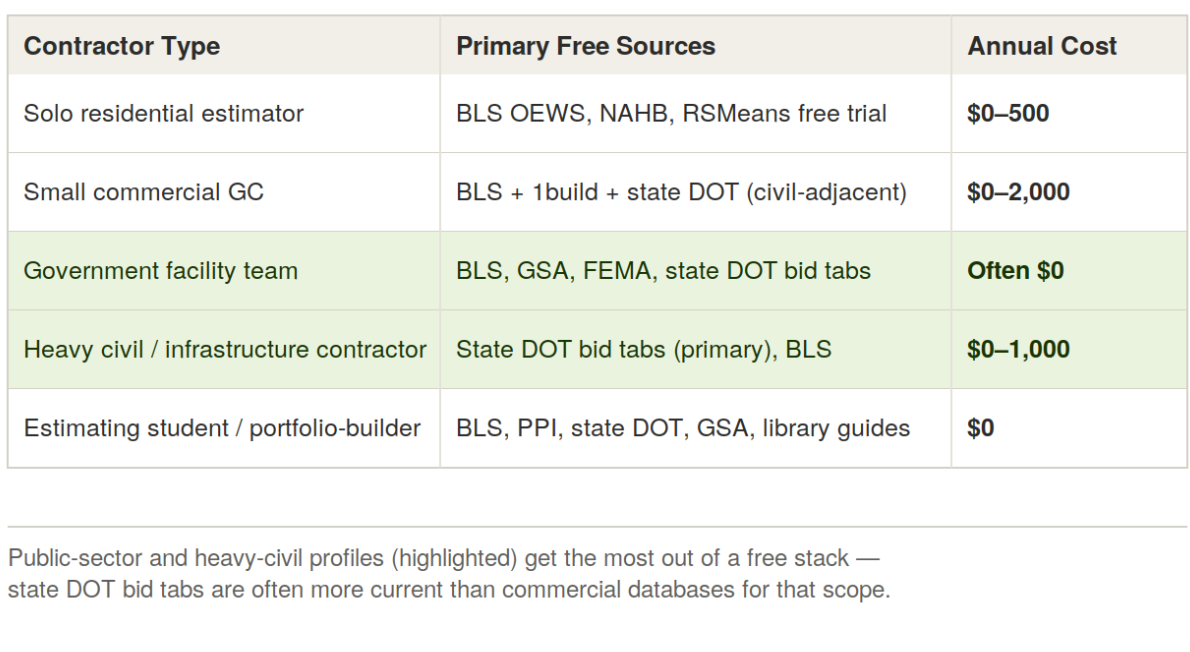
The free stack is usable across the five workflow stages, but assembling it takes a disciplined estimator process. Common patterns:
Solo residential estimator or small residential GC:
Labor: BLS OEWS for target metro area
Materials: Home Depot Pro / Lowe's Pro for common items, NAHB data for residential-specific benchmarks
Unit costs: RSMeans free trial for baseline (30-day window per project)
Localization: BLS regional indexes
Escalation: BLS PPI trends
Annual cost: $0–500
Small commercial GC bidding in local markets:
Labor: BLS OEWS + state labor department prevailing wage rates
Materials: 1build free tier, supplier catalogs
Unit costs: State DOT bid tabs (for civil-adjacent scope), RSMeans free trial (30-day window)
Localization: BLS metro indexes + GSA area factors
Escalation: BLS PPI, AGC reports
Annual cost: $0–2,000 depending on trial usage
Government facility team / public-sector work:
Labor: BLS + state labor department prevailing wage
Materials: GSA cost data, PPI trends
Unit costs: State DOT bid tabs (very strong for public-sector), GSA benchmarks, FEMA tools
Localization: GSA area factors
Escalation: BLS PPI, ENR historical indexes
Annual cost: Often $0 — most public-sector estimators use free data by policy
Heavy civil / infrastructure contractor:
Labor: BLS + state labor department prevailing wage (Davis-Bacon)
Materials: PPI, supplier catalogs
Unit costs: State DOT bid tabs (primary source — often the best data available even vs. paid alternatives)
Localization: State DOT regional data
Escalation: BLS PPI, state DOT trend reports
Annual cost: $0–1,000 — free stack is genuinely competitive for civil work
Estimating student or portfolio-builder:
All sources: BLS, PPI, state DOT bid tabs, GSA, university library research guides
Cost: $0
Trade-off: Depth of study for professional-quality outputs
When to Move to Paid Databases
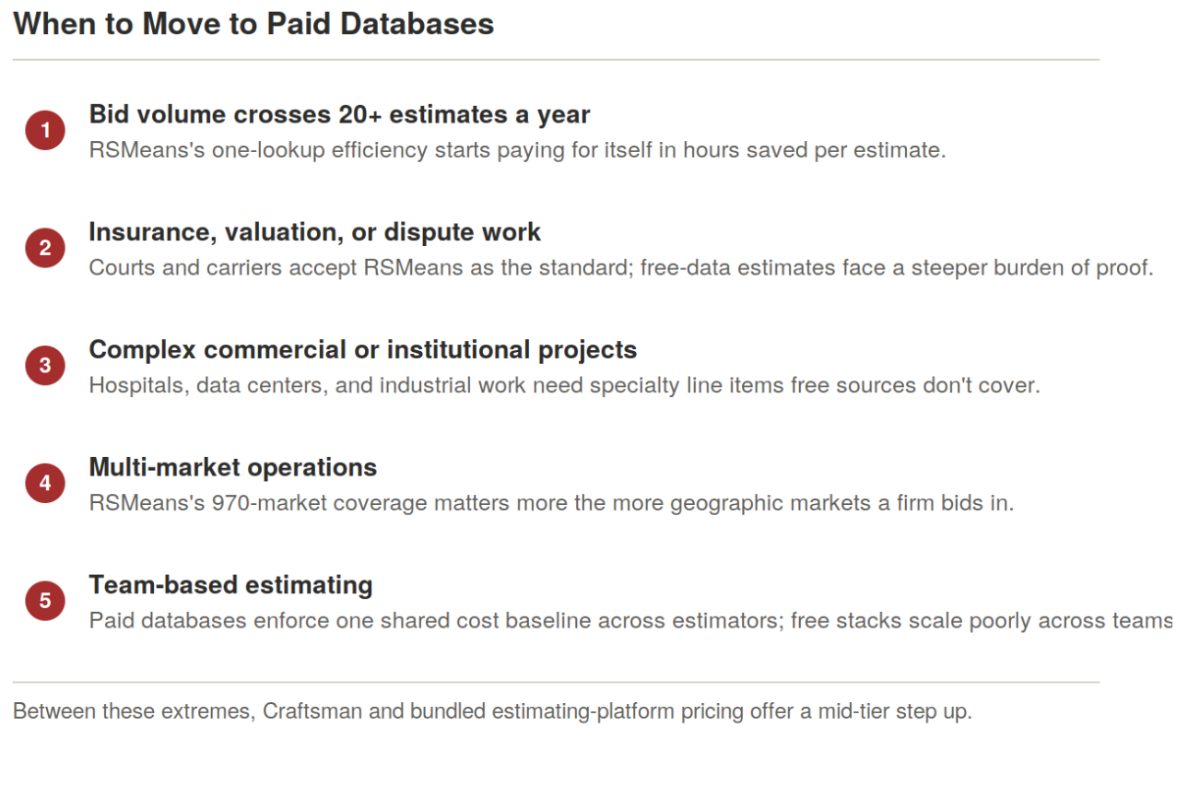
Every estimator eventually confronts the question: at what point does the time cost of assembling free data exceed the subscription cost of paid data? The honest signals:
Bid volume crossing 20+ estimates per year. At low bid volume, free data works. At sustained high volume, RSMeans's efficiency (one lookup vs. multi-source assembly) saves hours per estimate that pay for the subscription.
Insurance, valuation, or dispute work. Insurance carriers, banks, and courts accept RSMeans as the industry-recognized standard. Estimates based on free data are technically defensible but face a steeper burden of proof in professional contexts.
Complex commercial or institutional projects. RSMeans's 92,000+ line items include specialty items and assemblies that free sources don't cover. For hospitals, data centers, industrial facilities, and other complex commercial work, the free stack has coverage gaps that show up as scope-gap errors.
Multi-market operations. RSMeans's 970-market coverage matters more the more geographic markets the firm bids in. A single-market contractor gets less value than a multi-state operator.
Team-based estimating. When multiple estimators need to work from the same cost baseline for consistency, paid databases enforce that alignment. Free stacks scale poorly across teams.
Between these two extremes — free stack for low-volume work, RSMeans for high-volume — several intermediate options exist. Craftsman offers lower pricing than RSMeans. Some estimating platforms (STACK, ProEst) bundle cost data with the estimating software at combined pricing that's more accessible than RSMeans alone. Growing firms often move through the sequence: free stack → free trial, disciplined use → Craftsman or bundled → RSMeans as bid volume justifies.
Common Mistakes When Using Free Cost Data
Five error patterns account for most avoidable mistakes when working from free cost sources.
Error 1: Using year-old federal data as current:
BLS OEWS reports for May of the prior year. PPI historical trends can be a year old by the time you access them. Applying stale data to current bids introduces material price movement errors. Prevention: track update dates on every source and apply escalation adjustment for the interval between the data date and the current bid.
Error 2: Applying national data without localization:
BLS PPI is the national average; state DOT bid tabs are state-level. National pricing in a specific market is off by 10–40%, depending on the market. Prevention: always apply a localization factor before using national data in a local bid.
Error 3: Deriving productivity from too few data points:
Free data supplies rates but not productivity. Estimators deriving productivity from their own 2–3 past projects have small-sample-size problems. Prevention: cross-check productivity assumptions against industry sources (Craftsman productivity data — free tier, RSMeans free trial data, AGC benchmarks) before committing.
Error 4: Treating free calculator outputs as verified data:
Free construction calculators are useful for quick ballpark estimates, but their underlying data quality varies widely. Some use current BLS-derived methodology; others use aged data with unclear sourcing. Prevention: Use free calculators for sanity checks, not for primary estimate line items.
Error 5: Failing to document sources:
Estimates built from a mix of free sources are harder to defend in review than estimates from a single commercial database. Prevention: for every material and labor line, document the source, date, and adjustment factors applied. This documentation is what makes free-data estimates professionally defensible.
Frequently Asked Questions
What is the best free construction unit cost database in 2026?
No single free source matches RSMeans. The best free stack combines BLS OEWS for labor rates, BLS PPI for material trends, state DOT bid tabulations for civil unit costs, and free trials of RSMeans or Craftsman for project-specific completeness. State DOT bid tabs are the most underrated free source.
Is BLS data really usable for construction estimating?
Yes for labor rates and material trend tracking. BLS OEWS provides current wage data by occupation and metropolitan area. BLS PPI tracks material price movement by category. The gap is in the complete unit cost line items — BLS doesn't provide fully assembled unit costs the way RSMeans does.
How do state DOT bid tabulations work as a cost source?
Every state DOT publishes weighted average bid prices for standard pay items — earthwork, pavement, drainage, structures, etc. — reflecting real contractor bids on public projects. For heavy civil and infrastructure work, state DOT data is often more current and location-specific than commercial databases.
Can I use RSMeans free trial to build an estimate?
Yes. RSMeans offers a 30-day free trial on RSMeans Data Online. For a solo estimator working on one project at a time, disciplined use of the trial period is a legitimate path to RSMeans-quality data. The trade-off: you must complete the estimate within the trial window.
How do I localize national cost data to my specific market?
Combine BLS metro-level wage data with national baseline pricing, apply BLS regional price parities for material adjustment, and cross-check against state DOT bid tabulations if available. This produces localization roughly equivalent to RSMeans's City Cost Index for major metros; rural markets are harder.
Is CostFlowAI or a similar free calculator accurate enough for real bids?
Free calculators are useful for quick ballpark estimates and sanity checks. Their underlying data quality varies — CostFlowAI cites BLS and NAHB sources — but they're best used to cross-check primary estimates from more rigorous sources, not as the primary data itself.
When should I stop using free data and pay for RSMeans?
Practical inflection points: 20+ estimates per year, multi-market operations, insurance or dispute-adjacent work, team-based estimating across multiple estimators, or complex commercial projects where scope-gap risk from incomplete free data exceeds the subscription cost.
Does NAHB provide free cost data?
Yes for residential construction. NAHB publishes the Cost of Construction Survey monthly, tracking residential material and labor costs. For residential estimators, NAHB is a legitimate free primary source. Commercial estimators get less value from NAHB.
Are contractor forums a reliable source for cost intelligence?
Contractor forums (Reddit r/Construction, ContractorTalk, JLC forums) offer real pricing intelligence from working contractors. Data is anecdotal, not statistical — useful for spot-checking assumptions and understanding market conditions, not as primary line-item data.
Related Building Code Resources
- Building CodesGo/No-Go Readiness Checklist for Construction Project Pursuit Decisions
- Building CodesBest Construction Document Control Software in 2026
- Building CodesBest Construction Estimating Software for Mac in 2026
- Building CodesAddenda in Construction: Definition, Purpose, and How to Manage Them
- Building CodesBest Construction CRM Software for Bid Tracking and Follow-Up for General Contractors
Don't miss what's shaping AEC
The latest on preconstruction, codes, AEC news & trends — so you're always in the know.
MeltPlan
A curated stream of preconstruction intelligence, estimating innovation, takeoff breakthroughs, workflow advancements, and expert perspectives—powered by the AI and technology shaping the future of construction.
Visit Site